2022. 7. 12. 17:47ㆍGNN lab study
참고 사이트 :
A Gentle Introduction to Graph Neural Networks (distill.pub)
A Gentle Introduction to Graph Neural Networks
What components are needed for building learning algorithms that leverage the structure and properties of graphs?
distill.pub
번역, 재해석 및 정리
We are starting to see practical applications in areas such as antibacterial discovery , physics simulations , fake news detection, traffic prediction and recommendation systems
- 우리는 항균 발견, 물리학 시뮬레이션, 가짜 뉴스 탐지, 교통 예측 및 추천 시스템과 같은 분야에서 실용적인 응용을 시작했습니다.
We explores and explains modern graph neural networks. We divide this work into four parts.
- 우리는 최신 그래프 신경망을 탐색하고 설명합니다. 우리는 이 작업을 네 부분으로 나눕니다.
- we look at what kind of data is most naturally phrased as a graph, and some common examples.
- we explore what makes graphs different from other types of data, and some of the specialized choices we have to make when using graphs.
- we build a modern GNN, walking through each of the parts of the model, starting with historic modeling innovations in the field. We develop gradually from a bare-bones implementation to a state-of-the-art GNN model.
- we provide a GNN playground where you can play around with a real-world task and dataset to build a stronger intuition of how each component of a GNN model contributes to the predictions it makes.
- 우리는 먼저 그래프로 가장 자연스럽게 표현되는 데이터의 종류와 몇 가지 일반적인 예를 살펴봅니다.
- 우리는 데이터 유형에 따라 그래프가 어떻게 달라지는지 탐색하고, 그래프를 사용할때 해야만 하는 특정 조건들 중 일부를 살펴봅니다.
- 우리는 최근 GNN 모델을, 모델의 각 부분을 탐색해보면서 이 분야의 역사적인 모델링 혁신과 함께 구축합니다. 우리는 점차적으로 뼈대를 구축한 모델에서 최첨단 모델로 발전시킬 것 입니다.
- 우리는 각 GNN모델의 구성 요소들이 예측에 어떻게 기여하는지에 대해 더 강력한 직관을 구축하기 위해 실제 작업과 데이터셋을 가지고 놀 수 있는 GNN playground를 제공합니다.
To start, let’s establish what a graph is. A graph represents the relations (edges) between a collection of entities (nodes).
- 먼저 그래프가 무엇인지 알아 보겠습니다. 그래프는 엔터티들( nodes ) 간의 관계( edges, link )를 나타냅니다.


We can additionally specialize graphs by associating directionality to edges (directed, undirected).
- edges간 방향 연결을 통하여 그래프를 특수화 할 수 있습니다.
Images as graphs
- 이미지 데이터를 통해 그래프에 대해 구체적으로 알아보자.
We typically think of images as rectangular grids with image channels, representing them as arrays (e.g., 244x244x3 floats).
Another way to think of images is as graphs with regular structure, where each pixel represents a node and is connected via an edge to adjacent pixels.
Each non-border pixel has exactly 8 neighbors, and the information stored at each node is a 3-dimensional vector representing the RGB value of the pixel.
- 우리는 일반적으로 이미지를 이미지 채널이있는 직사각형 격자로 생각하여 배열 (예 : 244x244x3 부동 소수점)으로 나타냅니다.
- 이미지를 생각하는 또 다른 방법은 각 픽셀이 노드를 나타내고, 각 픽셀마다 인접한 픽셀에 연결되는 일반 구조의 그래프입니다.
- 각 가장자리가 아닌 픽셀에는 정확히 8개의 이웃이 있으며, 각 노드에 저장된 정보는 픽셀의 RGB 값을 나타내는 3차원 벡터입니다.
A way of visualizing the connectivity of a graph is through its adjacency matrix.
ex) each 25 pixels in a simple 5x5 image of a smiley face, and fill a matrix of n nodes × n nodes with an entry if two nodes share an edge.
Note that each of these three representations below are different views of the same piece of data.
- 그래프의 연결을 시각화하는 방법은 인접 행렬을 사용하는 것입니다.
- 예시로 웃는 얼굴의 간단한 5x5 이미지에서 각 25 픽셀을 주문하고 n nodes×n nodes 두 노드가 하나의 edge를 공유하는 경우 항목이 있습니다.
- 아래의 세 가지 표현은 각각 동일한 데이터 조각에 대한 서로 다른 보기입니다.
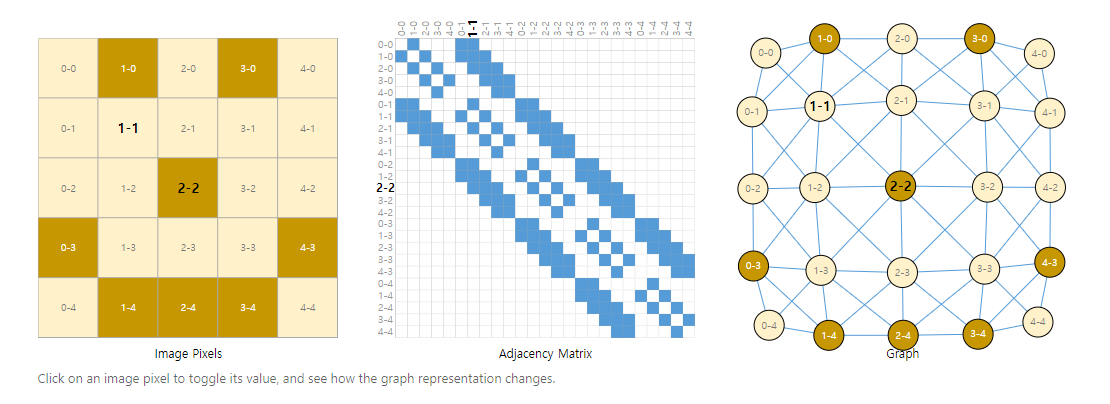
이후 가장 왼쪽 웃는 얼굴의 이미지로부터 가운데 이미지와 같은 인접 행렬을 구축한다.
서로 edges(=link)가 되어있다면 색을 칠힌다.
가장 우측 이미지는 이를 그래프로 표현한 것이다.
따라서 가장 좌측부터 이미지 데이터를 이미지, 인접 행렬, 그래프 순으로 표현한 것이다.
Text as graphs
We can digitize text by associating indices to each character, word, or token, and representing text as a sequence of these indices.
This creates a simple directed graph, where each character or index is a node and is connected via an edge to the node that follows it.
- 인덱스를 각 문자, 단어 또는 토큰에 연결하고 텍스트를 이러한 인덱스의 시퀀스로 표현하여 텍스트를 디지털화할 수 있습니다.
- 이렇게 하면 각 문자 또는 인덱스가 노드이고 edge를 통해 그 뒤에 오는 노드에 연결되는 간단한 방향 그래프가 만들어집니다.

In practice, this is not usually how text and images are encoded: these graph representations are redundant since all images and all text will have very regular structures.
- 실제로, 이것은 일반적으로 텍스트와 이미지가 인코딩되는 방식이 아닙니다 : 이러한 그래프 표현은 모든 이미지와 모든 텍스트가 매우 규칙적인 구조를 갖기 때문에 중복됩니다.
The adjacency matrix for text is just a diagonal line, because each word only connects to the prior word, and to the next one.
- 텍스트에 대한 인접 행렬은 각 단어가 이전 단어와 다음 단어에만 연결되기 때문에 대각선에 불과합니다.
Graph-valued data in the wild (= in real-world)
- 실제 현실에서의 그래프-값 데이터
Graphs are a useful tool to describe data you might already be familiar with.
Let’s move on to data which is more heterogeneously structured.
In these examples, the number of neighbors to each node is variable (as opposed to the fixed neighborhood size of images and text). This data is hard to phrase in any other way besides a graph.
- 그래프는 이미 익숙한 데이터를 설명하는 데 유용한 도구입니다.
- 좀 더 이질적으로 구조화 된 데이터로 넘어 갑시다.
- 예를 들어서, 각 노드에 대한 이웃들의 수는 가변적이다. (이미지 및 텍스트의 고정된 이웃 크기와 반대). 이 데이터는 그래프 이외의 다른 방법으로 표현하기가 어렵습니다.
Molecules as graphs
- 분자를 그래프로
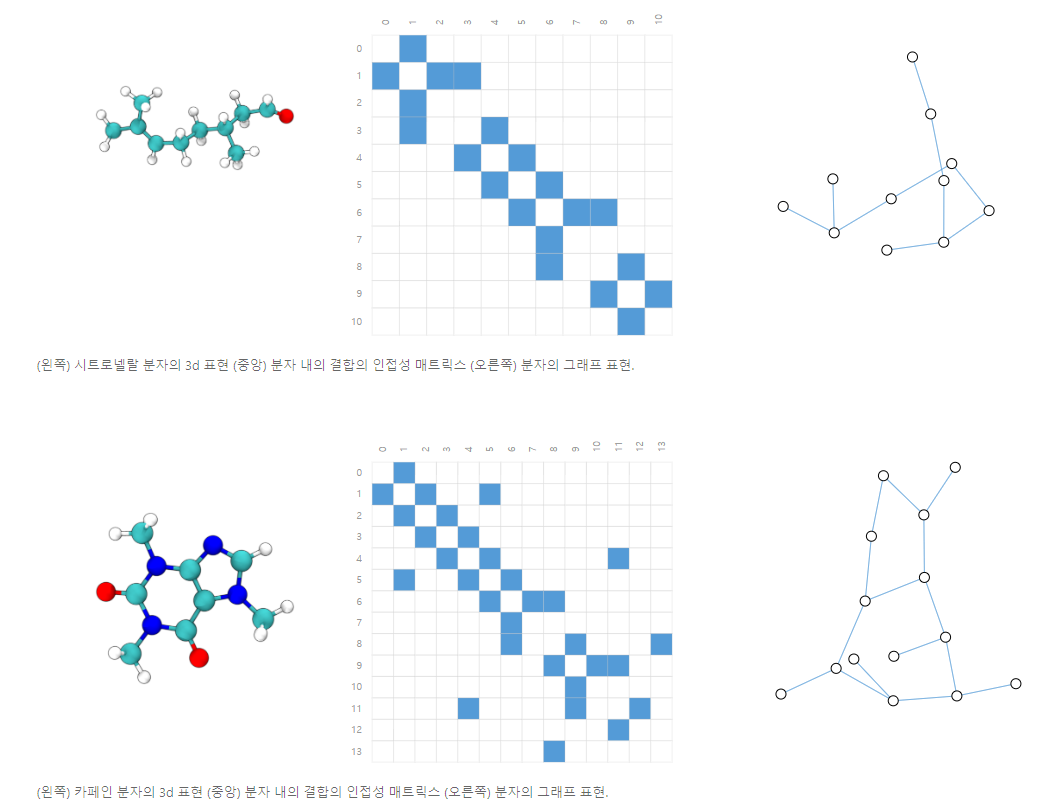
Molecules are the building blocks of matter, and are built of atoms and electrons in 3D space.
All particles are interacting, but when a pair of atoms are stuck in a stable distance from each other, we say they share a covalent bond.
Different pairs of atoms and bonds have different distances (e.g. single-bonds, double-bonds).
It’s a very convenient and common abstraction to describe this 3D object as a graph, where nodes are atoms and edges are covalent bonds.
Here are two common molecules, and their associated graphs.
- 분자는 물질의 빌딩 블록이며 3D 공간에서 원자와 전자로 만들어집니다.
- 모든 입자는 상호 작용하지만, 한 쌍의 원자가 서로 안정된 거리에 붙어있을 때, 우리는 그들이 공유 결합을 공유한다고 말합니다.
- 원자와 결합의 서로 다른 쌍은 서로 다른 거리 (예 : 단일 결합, 이중 결합)를 갖습니다.
- 이 3D 객체를 그래프로 설명하는 것은 매우 편리하고 일반적인 추상화이며, node는 원자이고 edges는 공유 결합입니다. - 다음은 두 가지 일반적인 분자와 관련 그래프입니다.
Social networks as graphs
- 소셜 네트워크를 그래프로
Social networks are tools to study patterns in collective behaviour of people, institutions and organizations.
We can build a graph representing groups of people by modelling individuals as nodes, and their relationships as edges.
- 소셜 네트워크는 사람, 기관 및 조직의 집단 행동 패턴을 연구하는 도구입니다.
- 우리는 개인을 node로 모델링하고 그들의 관계를 edge로 모델링하여 사람들의 그룹을 나타내는 그래프를 만들 수 있습니다.
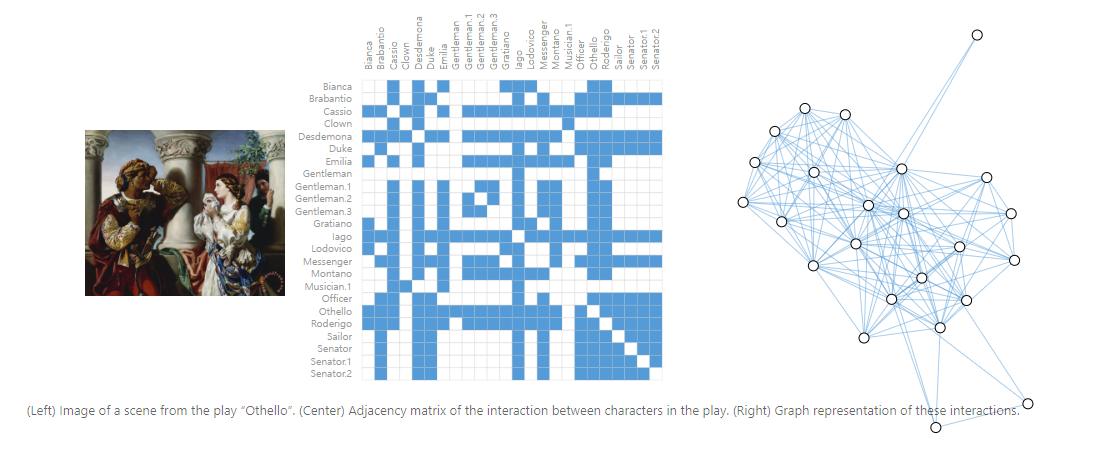
Unlike image and text data, social networks do not have identical adjacency matrices.
- 이미지 및 텍스트 데이터와 달리 소셜 네트워크에는 동일한 인접 행렬이 없습니다.
다른 예시들 (여러가지 데이터를 그래프로)
- Citation networks as graphs (인용 네트워크를 그래프로) : 논문 출판 시 다른 학자들의 논문을 인용. 이때 논문은 node, 인용은 edge로 하여 인용 네트워크를 그래프로 시각화 할 수 있다.
- In computer vision, we sometimes want to tag objects in visual scenes. ( 컴퓨터 비전에서 물체에 태그를 그래프로) : 물체를 node, 태그를 edge로 하여 그래프로 시각화 가능.
- Machine learning models, programming code and math equations can also be phrased as graphs. ( 기계학습 모델, 프로그래밍 코드, 수학 방정식도 그래프로 표현 가능) : 변수를 node, 변수의 입/출력을 edge로 하여 그래프로 시각화.
What types of problems have graph structured data?
- 그래프 구조 데이터는 어떤 유형의 문제를 가질까?
There are three general types of prediction tasks on graphs
- graph-level
- node-level
- edge-level.
- 그래프에는 세 가지 일반적인 유형의 예측 작업이 있습니다: graph 수준 예측, node 수준 및 edge 수준 예측
let’s take a tour through the three classes of graph prediction problems in more detail, and provide concrete examples of each.
- 그래프 예측 문제의 세 가지 클래스를 더 자세히 살펴보고, 각각에 대한 구체적인 예를 제공하겠습니다.
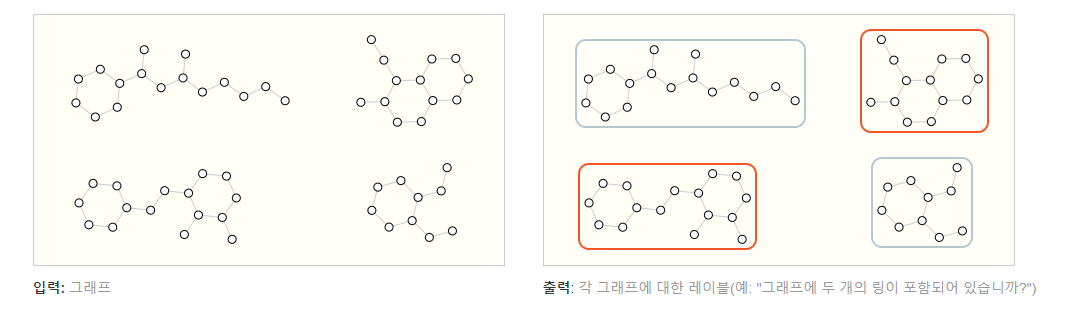
Graph-level task
In a graph-level task, our goal is to predict the property of an entire graph.
For example, for a molecule represented as a graph, we might want to predict what the molecule smells like, or whether it will bind to a receptor implicated in a disease.
- 그래프 수준 작업에서 우리의 목표는 전체 그래프의 속성을 예측하는 것입니다.
- 예를 들어, 그래프로 표시된 분자의 경우 분자가 어떤 냄새를 띄는지 또는 질병에 연루된 수용체에 결합할지 말지 여부를 예측할 수 있습니다.
With text, a similar problem is sentiment analysis where we want to identify the mood or emotion of an entire sentence at once.
- 텍스트의 경우, 비슷한 문제는 전체 문장의 기분이나 감정을 한 번에 식별하려는 감정 분석입니다.
Node-level task
Node-level tasks are concerned with predicting the identity or role of each node within a graph.
- 노드 수준 작업은 그래프 내에서 각 노드의 ID 또는 역할을 예측하는 것과 관련이 있습니다.
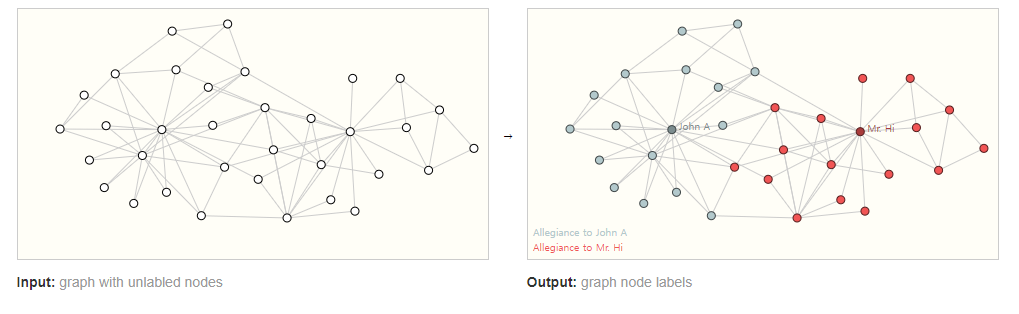
A classic example of a node-level prediction problem is Zach’s karate club.
The dataset is a single social network graph made up of individuals that have sworn allegiance to one of two karate clubs after a political rift.
As the story goes, a feud between Mr. Hi (Instructor) and John H (Administrator) creates a schism in the karate club.
The nodes represent individual karate practitioners, and the edges represent interactions between these members outside of karate.
The prediction problem is to classify whether a given member becomes loyal to either Mr. Hi or John H, after the feud.
In this case, distance between a node to either the Instructor or Administrator is highly correlated to this label.
- node 수준 예측 문제의 전형적인 예는 Zach의 가라데 클럽입니다.
- 데이터 세트는 정치적 균열 이후 두 가라테 클럽 중 하나에 충성을 맹세 한 개인으로 구성된 단일 소셜 네트워크 그래프입니다.
- 이야기가 진행됨에 따라 Mr. Hi (강사)와 John H (관리자) 사이의 불화는 가라데 클럽에 분열을 일으킵니다.
- node는 개별 가라데 실무자를 대표하며, edges는 가라데 외부의 구성원 간의 상호 작용을 나타냅니다.
- 예측 문제는 불화 이후 주어진 구성원이 Mr. Hi와 John H 중 누구에게 충성하는지 여부를 분류하는 것입니다. (=label)
- 이 경우 노드와 강사 또는 관리자 간의 거리(distance)는 이 레이블과 높은 상관 관계가 있습니다.
Following the image analogy, node-level prediction problems are analogous to 'image segmentation', where we are trying to label the role of each pixel in an image.
With text, a similar task would be predicting the parts-of-speech of each word in a sentence (e.g. noun, verb, adverb, etc).
- 이미지 비유에 따라 node-level prediction problems는 이미지에서 각 픽셀의 역할에 레이블을 지정하려고 하는 'image segmentation'과 유사합니다.
- 텍스트를 사용하면 비슷한 작업이 문장의 각 단어의 음성 부분 (예 : 명사, 동사, 부사 등)을 예측하는 것입니다.
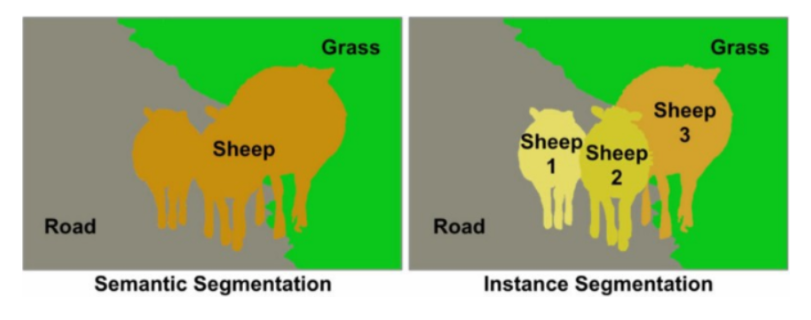
세그멘테이션(Segmentation)
이미지에서 픽셀단위로 관심 객체를 추출하는 방법.
이미지에서 개체가 있는 위치, 해당 개체의 모양, 어떤 픽셀이 어떤 객체에 속하는지 등을 알고 싶다고 가정할 때, 이미지를 분할해 이미지의 각 픽셀에 레이블을 부여하는 것이다.
이러한 세그멘테이션은 여러 가지 종류로 나뉜다.
- 시멘틱 세그멘테이션(Sementic Segmentation)
- 인스턴스 세그멘테이션(Instance Segmentation)
1. 시멘틱 세그멘테이션(Sementic Segmentation)
실제로 인식할 수 있는 물리적 의미 단위로 인식하는 세그멘테이션을 시멘틱 세그멘테이션(sementic segmentation)이라고 한다.
즉, 이미지에서 픽셀을 사람, 자동차, 비행기 등의 물리적 단위로 분류하는 방법이다.

2. 인스턴스 세그멘테이션(Instance Segmentation)
시멘틱 세그멘테이션은 사진에서 '사람'이라는 객체 자체를 추출한다. 결국 다른 사람이더라도 상관없이 같은 라벨로 표현된다.
인스턴스 세그멘테이션은 사람을 개개인별로 다른 라벨을 가지게 한다.
Edge-level task
One example of edge-level inference is in image scene understanding.
Beyond identifying objects in an image, deep learning models can be used to predict the relationship between them.
We can phrase this as an edge-level classification: given nodes that represent the objects in the image, we wish to predict which of these nodes share an edge or what the value of that edge is.
If we wish to discover connections between entities, we could consider the graph fully connected and based on their predicted value prune edges to arrive at a sparse graph.
- edge-level 추론의 한 가지 예는 이미지 장면 이해입니다.
- 이미지에서 객체를 식별하는 것 외에도 딥 러닝 모델을 사용하여 객체 간의 관계를 예측할 수 있습니다.
- 우리는 이것을 edges-level 분류로 표현할 수 있습니다 : 이미지의 객체를 나타내는 노드가 주어지면, 우리는 이 노드 중 어느 것이 edge를 공유하는지 또는 그 edge의 값이 무엇인지 예측하고자 합니다.
- 엔티티(node) 간의 연결(edge)을 발견하려면 그래프가 완전히 연결된 것으로 간주하고, 예측 된 값을 기반으로 edges를 정리하여 희소 그래프에 도달할 수 있습니다.


The challenges of using graphs in machine learning
- ML에서 graph 데이터를 사용하기.
So, how do we go about solving these different graph tasks with neural networks?
The first step is to think about how we will represent graphs to be compatible with neural networks.
- 그렇다면 신경망으로 이러한 다양한 그래프 작업을 어떻게 해결할 수 있을까요?
- 첫 번째 단계는 신경망과 호환 가능한 그래프를 어떻게 표현할 것인지 생각하는 것입니다.
Machine learning models typically take rectangular or grid-like arrays as input.
So, it’s not immediately intuitive how to represent them in a format that is compatible with deep learning.
Graphs have up to four types of information that we will potentially want to use to make predictions: nodes, edges, global-context and connectivity.
The first three are relatively straightforward: for example, with nodes we can form a node feature matrix N by assigning each node an index i and storing the feature for node(i) in N.
While these matrices have a variable number of examples, they can be processed without any special techniques.
- ML 모델은 일반적으로 직사각형 또는 그리드형 배열을 input으로 사용합니다.
- 따라서 딥 러닝과 호환되는 형식으로 표현(graph를)하는 방법은 즉시 직관적이지 않습니다.
- 그래프에는 우리가 잠재적으로 예측하고자 하는 최대 네 가지 유형의 정보(노드, 에지, 글로벌 컨텍스트 및 연결)가 있습니다.
- 처음 세 가지는 비교적 간단합니다 : 예를 들어, 각 노드에 index (i)를 할당하고 node(i)에 대한 feature를 N에 저장함으로써 노드 feature matrix N를 형성 할 수 있습니다.
- 이러한 행렬에는 다양한 수의 예제가 있지만, 특별한 기술 없이도 처리 할 수 있습니다.
However, representing a graph’s connectivity is more complicated.
Perhaps the most obvious choice would be to use an adjacency matrix, since this is easily tensorisable.
However, this representation has a few drawbacks.
From the example dataset table, we see the number of nodes in a graph can be on the order of millions, and the number of edges per node can be highly variable.
Often, this leads to very sparse adjacency matrices, which are space-inefficient.
- 반면에, 그래프의 연결(link, edge)을 나타내는 것은 더 복잡합니다.
- 아마도 가장 확실한 선택은 인접 행렬을 사용하는 것입니다. 왜냐하면 쉽게 tensorisable 하기 때문입니다.
(tensorflow에서 사용 가능함을 나타내는 단어인 것 같다.)
- 그러나 이 표현에는 몇 가지 단점이 있습니다.
- 예제 데이터 집합 테이블에서 그래프의 노드 수는 수백만 개일 수 있으며 노드당 edges 수는 매우 가변적일 수 있습니다.
- 종종, 이것은 공간 비효율적인 매우 희소한 인접 행렬일 수 있습니다.
Another problem is that there are many adjacency matrices that can encode the same connectivity, and there is no guarantee that these different matrices would produce the same result in a deep neural network (that is to say, they are not permutation invariant).
- 또 다른 문제는 동일한 connectivity를 인코딩할 때 인코딩 가능한 다수의 인접 행렬이 있으며, 이러한 같은 connectivity를 표현한 서로 다른 인접 행렬들이 deep neural network에서 동일한 결과를 생성한다는 보장이 없다는 것입니다. (즉, 순열 불변이 아닙니다).

One elegant and memory-efficient way of representing sparse matrices is as adjacency lists.
These describe the connectivity of edge e(k) between nodes n(i) and n(j) as a tuple (i,j) in the k-th entry of an adjacency list.
Since we expect the number of edges to be much lower than the number of entries for an adjacency matrix (n**2), we can avoid computation and storage on the disconnected parts of the graph.
- 희소 행렬을 표현하는 메모리 효율적인 방법 중 하나는 인접 목록을 사용하는 것입니다.
- 이는 n(i)와 n(j) 인접 목록의 k 번째 항목에있는 튜플 (i, j)로 edge e(k)의 connectivity을 설명합니다.
- edges의 수가 인접 행렬에 대한 항목 수(n**2)보다 훨씬 낮을 것으로 예상하기 때문에, 우리는 그래프의 연결이 끊어진 부분에 대한 계산 및 저장을 피할 수 있습니다.
Graph Neural Networks
Now that the graph’s description is in a matrix format that is permutation invariant, we will describe using graph neural networks (GNNs) to solve graph prediction tasks.
A GNN is an optimizable transformation on all attributes of the graph (nodes, edges, global-context) that preserves graph symmetries (permutation invariances).
We’re going to build GNNs using the “message passing neural network” framework proposed by Gilmer et al.
(using the Graph Nets architecture schematics introduced by Battaglia et al. )
GNNs adopt a “graph-in, graph-out” architecture meaning that these model types accept a graph as input, with information loaded into its nodes, edges and global-context, and progressively transform these embeddings, without changing the connectivity of the input graph.
- 이제 그래프의 설명이 순열 불변의 행렬 형식(인접 목록)이므로 그래프 신경망(GNN)을 사용하여 그래프 예측 작업을 해결하는 방법에 대해 설명합니다.
- GNN은 그래프 대칭(순열 불변성)을 유지하는 그래프의 모든 속성(nodes, edges, global-context)에 대해 최적화된 변환입니다.
- 우리는 Gilmer et al. 이 제안한 "메시지 전달 신경망"프레임 워크를 사용하여 GNN을 구축 할 것입니다.
- (Battaglia et al. GNNs가 도입 한 Graph Nets 구조 회로도를 사용.)
- GNN이 "graph-in, graph-out" 아키텍처를 채택한다는 것은 이러한 모델 유형이 그래프를 입력으로 받아 들여 nodes, edges and global-context에 load하고 input(graph)의 connectivity를 변경하지 않고 점진적으로 이러한 임베딩을 변환한다는 것을 의미합니다.
The simplest GNN
참고 사이트 : image segmentation
[딥러닝] 이미지 세그멘테이션(Image Segmentation)
세그멘테이션(Segmentation) 이미지에서 픽셀단위로 관심 객체를 추출하는 방법. 이미지에서 개체가 있는 위치, 해당 개체의 모양, 어떤 픽셀이 어떤 객체에 속하는지 등을 알고 싶다고 가정할 때,
velog.io
'GNN lab study' 카테고리의 다른 글
| GNN 세번째 (0) | 2022.07.24 |
|---|---|
| GNN 개념, 관련 기본 지식 (0) | 2022.07.08 |